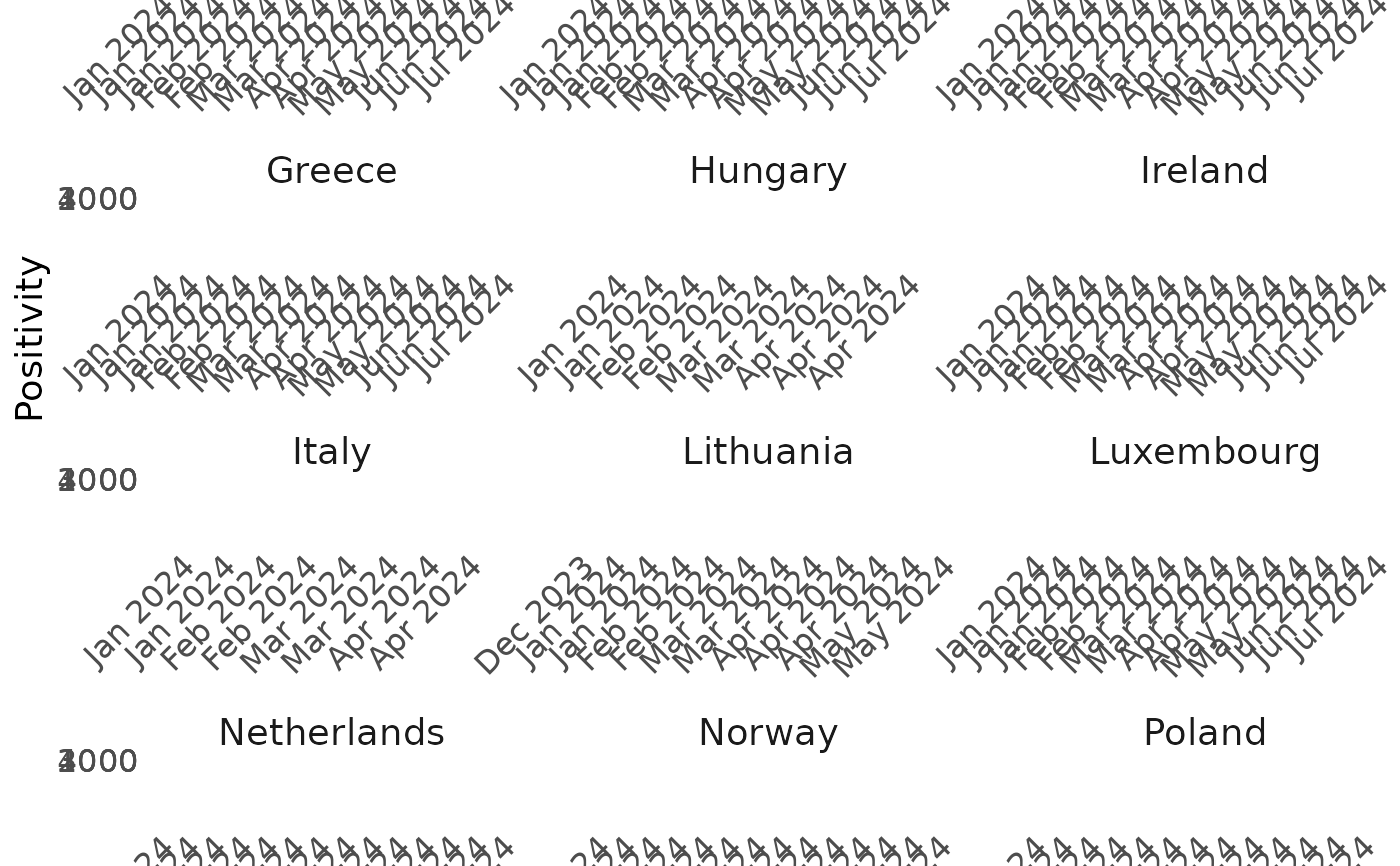
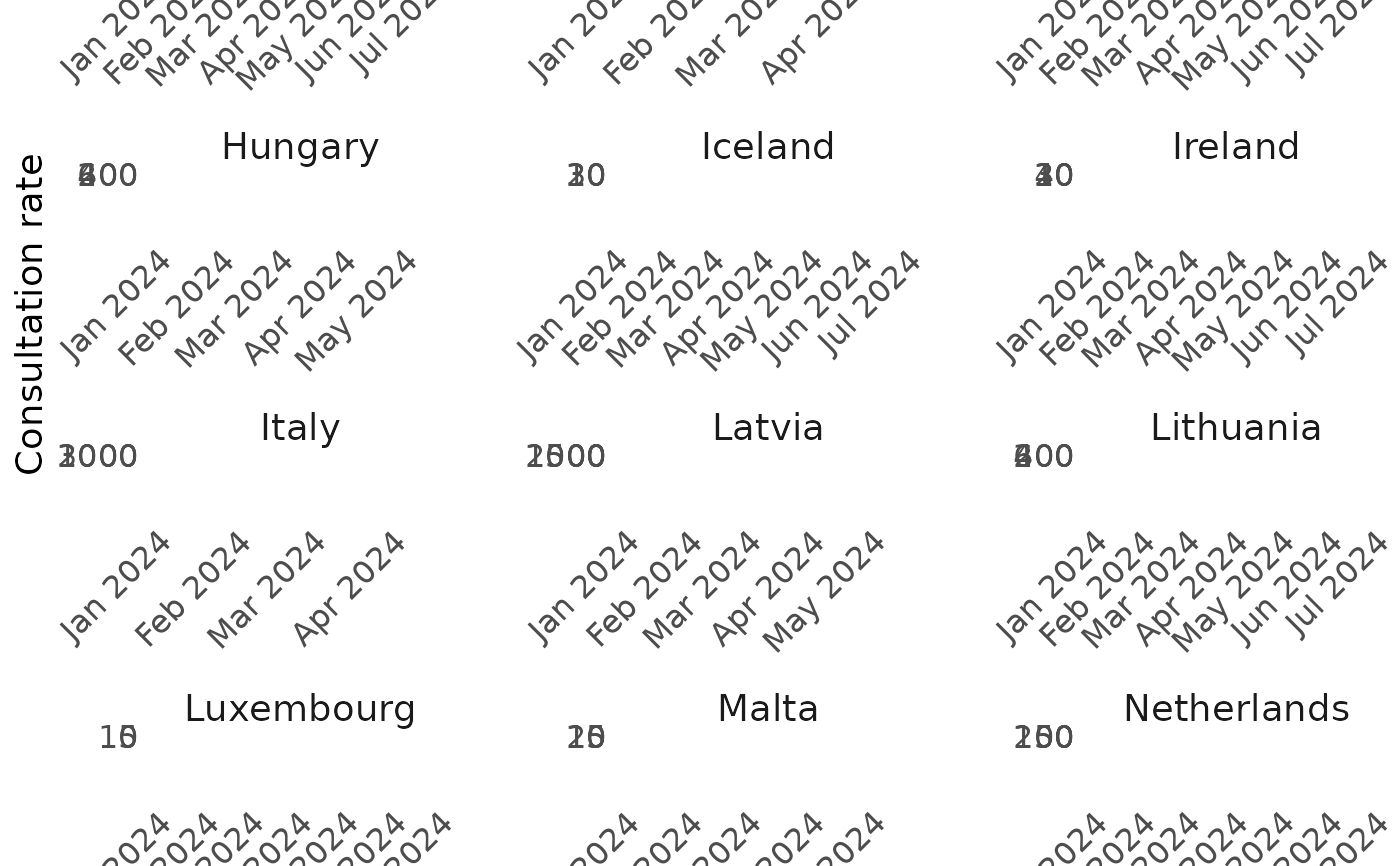
Creates a ggplot2 visualization of ERVISS data, with facets by country. This is a generic function that can plot any of the available data types.
Arguments
- data
A data.table or data.frame containing ERVISS data, typically output from
get_erviss_data.- type
Type of data. One of: "positivity", "variants", "ili_ari_rates", "sari_rates", "sari_positivity", "nonsentinel_severity", "nonsentinel_tests".
- date_breaks
A string specifying the date breaks for the x-axis (e.g., "1 month", "2 weeks"). If NULL, a sensible default is chosen based on the data type.
- date_format
A string specifying the date format for x-axis labels (e.g.,
"%b %Y"for "Jan 2024")
Examples
# \donttest{
# Plot positivity data
data <- get_erviss_data("positivity",
date_min = as.Date("2024-01-01"),
date_max = as.Date("2024-06-30"),
pathogen = "SARS-CoV-2"
)
plot_erviss_data(data, type = "positivity")
 # Plot ILI/ARI rates
data <- get_erviss_data("ili_ari_rates",
date_min = as.Date("2024-01-01"),
date_max = as.Date("2024-06-30"),
indicator = "ILIconsultationrate"
)
plot_erviss_data(data, type = "ili_ari_rates")
# Plot ILI/ARI rates
data <- get_erviss_data("ili_ari_rates",
date_min = as.Date("2024-01-01"),
date_max = as.Date("2024-06-30"),
indicator = "ILIconsultationrate"
)
plot_erviss_data(data, type = "ili_ari_rates")
 # }
# }