Quick plot of ERVISS non-sentinel tests/detections data
Source:R/erviss_nonsentinel_tests.R
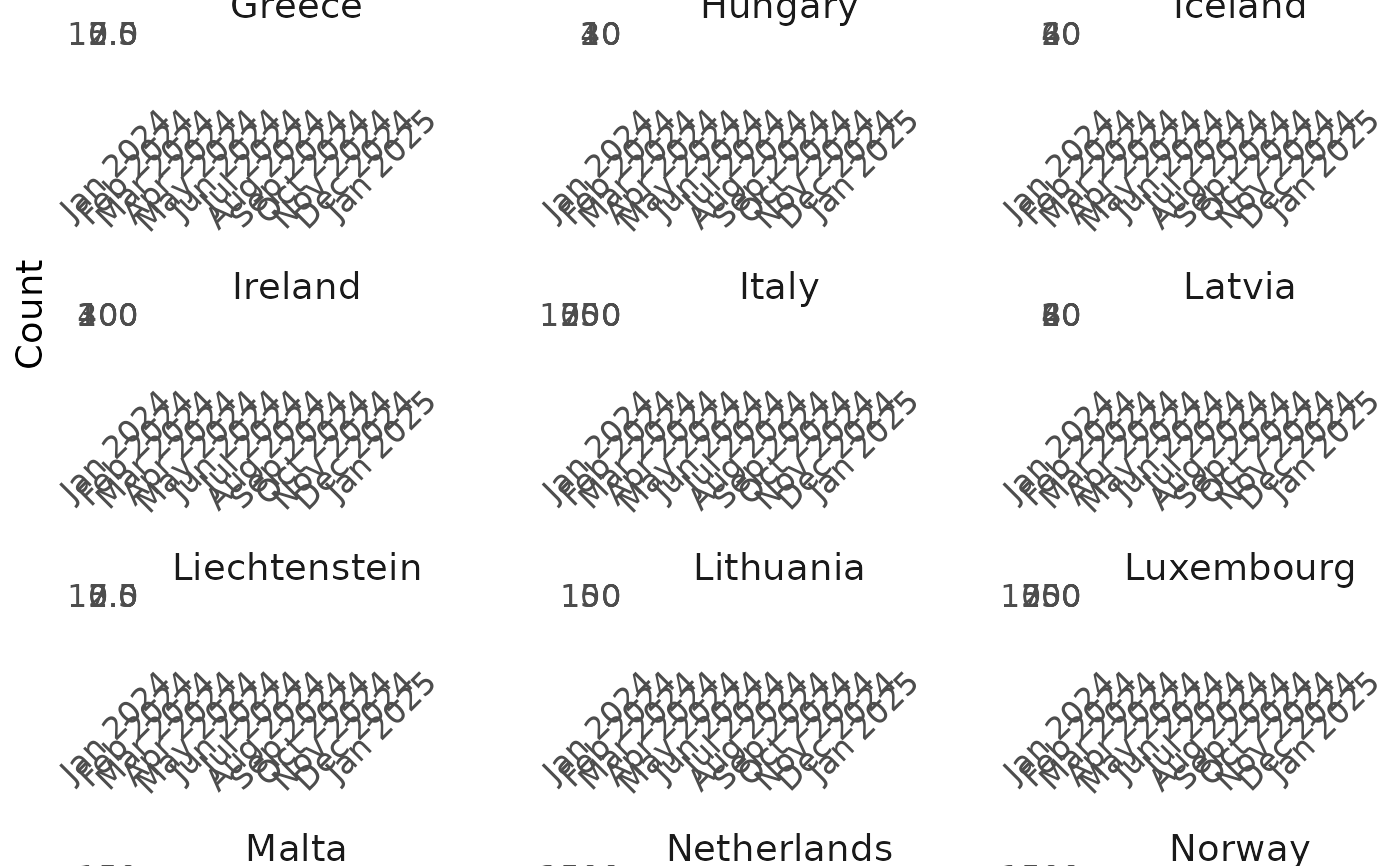
quick_plot_nonsentinel_tests.RdConvenience function that fetches and plots ERVISS non-sentinel tests/detections
data in one step.
For more control, use get_nonsentinel_tests followed by
plot_nonsentinel_tests.
Usage
quick_plot_nonsentinel_tests(
  csv_file = NULL,
  date_min,
  date_max,
  pathogen = "",
  indicator = "",
  age = "",
  countries = "",
  date_breaks = "1 month",
  date_format = "%b %Y",
  use_snapshot = FALSE,
  snapshot_date = NULL
)
Arguments
- csv_file
Path to a local CSV file or URL containing the ERVISS data. If NULL (default), data is fetched from the official ERVISS repository.
- date_min
Start date of the period (Date object)
- date_max
End date of the period (Date object)
- pathogen
Character vector of pathogen names to filter. Use "" (default) to include all pathogens.
- indicator
Character vector of indicators to filter: "detections", "tests", or both. Use "" (default) to include all indicators.
- age
Character vector of age groups to filter (e.g., "total"). Use "" (default) to include all age groups.
- countries
Character vector of country names to filter. Use "" (default) to include all countries.
- date_breaks
A string specifying the date breaks for the x-axis (e.g., "1 month", "2 weeks")
- date_format
A string specifying the date format for x-axis labels (e.g.,
"%b %Y"for "Jan 2024")- use_snapshot
Logical. If TRUE, fetches a historical snapshot; if FALSE (default), fetches the latest data. Ignored if csv_file is provided.
- snapshot_date
Date of the snapshot to retrieve. Required if use_snapshot = TRUE and csv_file is NULL.