Convenience function that fetches and plots ERVISS data in one step.
This is a generic function that can handle any of the available data types.
For more control, use get_erviss_data followed by
plot_erviss_data.
Usage
quick_plot_erviss_data(
  type = ERVISS_TYPES,
  csv_file = NULL,
  date_min,
  date_max,
  pathogen = "",
  variant = "",
  indicator = "",
  age = "",
  countries = "",
  min_value = 0,
  date_breaks = NULL,
  date_format = "%b %Y",
  use_snapshot = FALSE,
  snapshot_date = NULL
)
Arguments
- type
Type of data. One of: "positivity", "variants", "ili_ari_rates", "sari_rates", "sari_positivity", "nonsentinel_severity", "nonsentinel_tests".
- csv_file
Path to a local CSV file or URL containing the ERVISS data. If NULL (default), data is fetched from the official ERVISS repository.
- date_min
Start date of the period (Date object)
- date_max
End date of the period (Date object)
- pathogen
Character vector of pathogen names to filter. Used for types: "positivity", "sari_positivity", "nonsentinel_severity", "nonsentinel_tests". Use "" (default) to include all pathogens.
- variant
Character vector of variant names to filter. Only used for type = "variants". Use "" (default) to include all variants.
- indicator
Character vector of indicators to filter. The available values depend on the data type. Use "" (default) to include all indicators.
- age
Character vector of age groups to filter. Used for types: "ili_ari_rates", "sari_rates", "sari_positivity", "nonsentinel_severity", "nonsentinel_tests". Use "" (default) to include all age groups.
- countries
Character vector of country names to filter. Use "" (default) to include all countries.
- min_value
Minimum value threshold (default: 0). Only used for type = "variants".
- date_breaks
A string specifying the date breaks for the x-axis (e.g., "1 month", "2 weeks"). If NULL, a sensible default is chosen based on the data type.
- date_format
A string specifying the date format for x-axis labels (e.g.,
"%b %Y"for "Jan 2024")- use_snapshot
Logical. If TRUE, fetches a historical snapshot; if FALSE (default), fetches the latest data. Ignored if csv_file is provided.
- snapshot_date
Date of the snapshot to retrieve. Required if use_snapshot = TRUE and csv_file is NULL.
Examples
# \donttest{
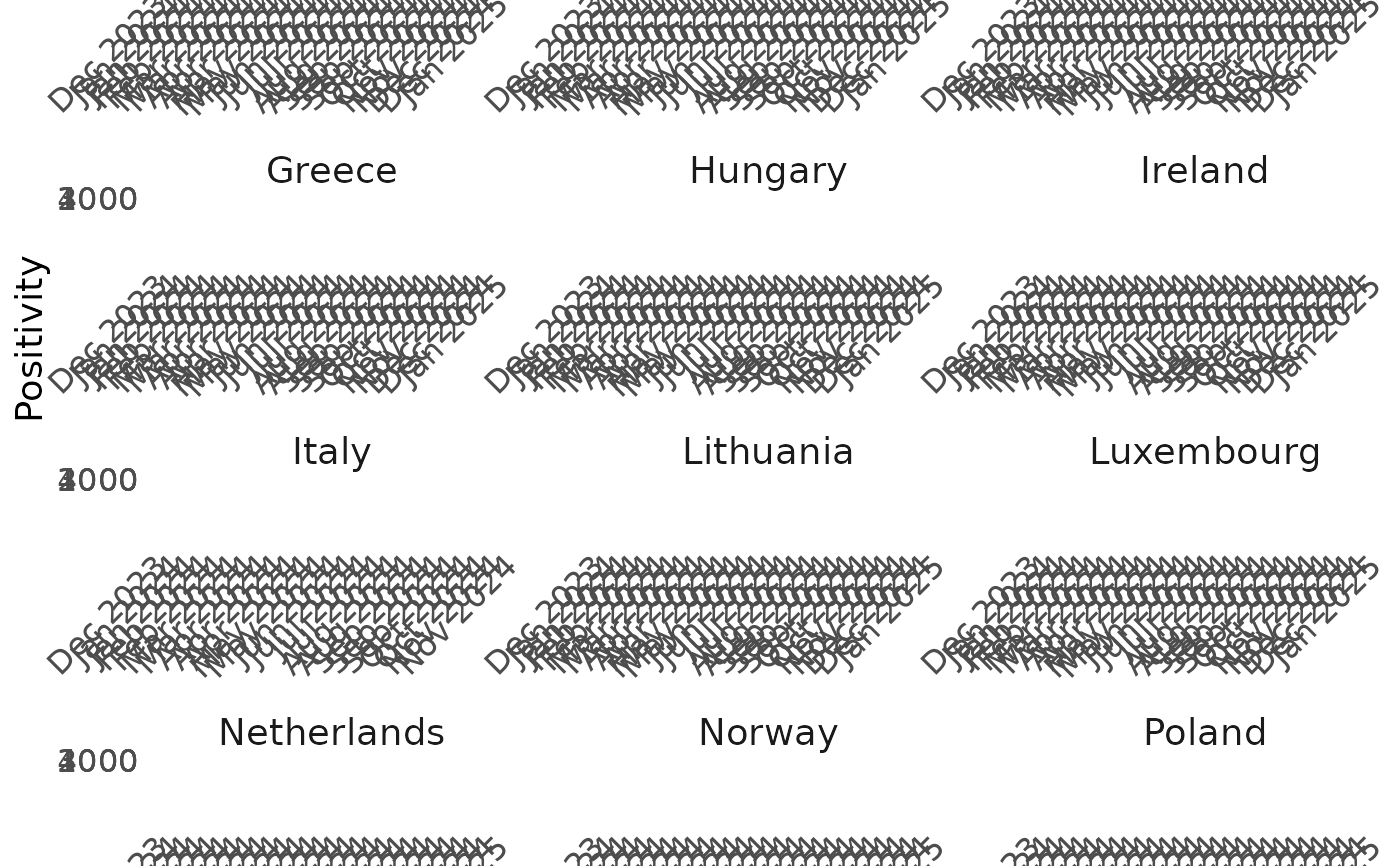
# Quick visualization of positivity data
quick_plot_erviss_data(
type = "positivity",
date_min = as.Date("2024-01-01"),
date_max = as.Date("2024-12-31"),
pathogen = "SARS-CoV-2"
)
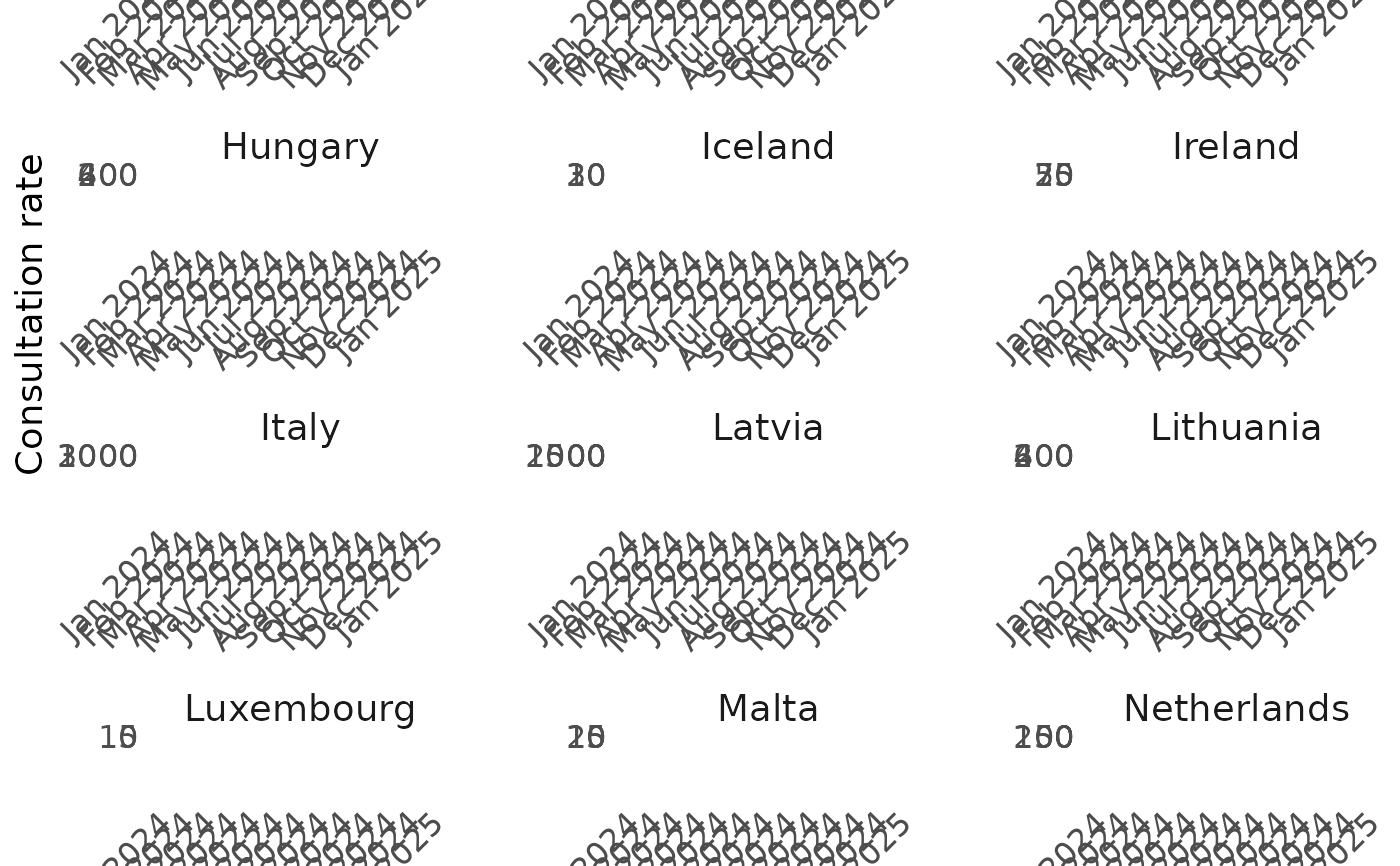
 # Quick visualization of ILI rates
quick_plot_erviss_data(
type = "ili_ari_rates",
date_min = as.Date("2024-01-01"),
date_max = as.Date("2024-12-31"),
indicator = "ILIconsultationrate"
)
# Quick visualization of ILI rates
quick_plot_erviss_data(
type = "ili_ari_rates",
date_min = as.Date("2024-01-01"),
date_max = as.Date("2024-12-31"),
indicator = "ILIconsultationrate"
)
 # }
# }