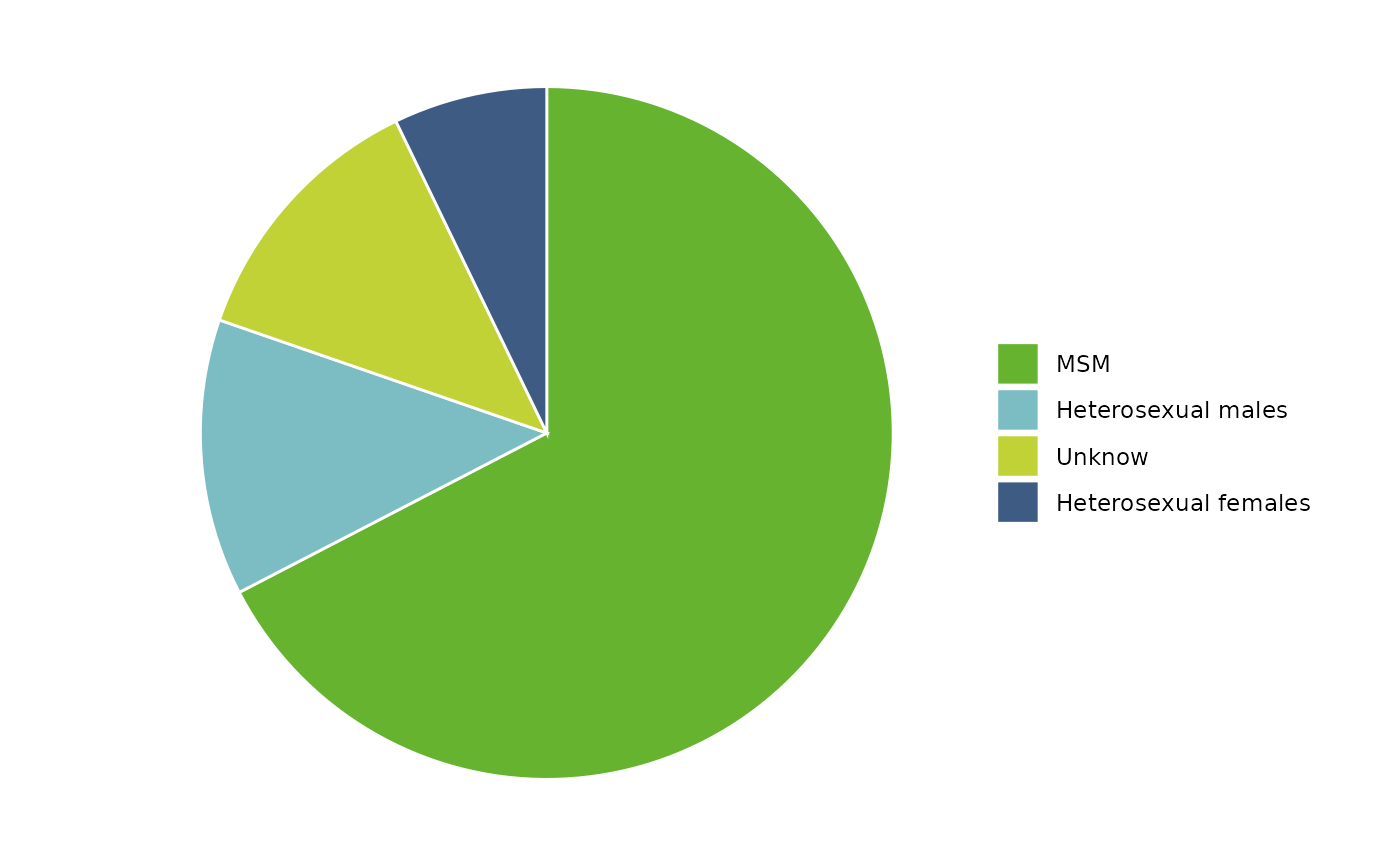
Pie chart
plotPie.RdThis function draws a pie chart of the values of variable 'Xvar'
with the labels from the categorical variable 'Labels'.
Expects aggregated data.
Usage
plotPie(
  .data,
  xvar = "",
  labels = "",
  fill_colors = EcdcColors(col_scale = "qual", n = nrow(.data))
)
Arguments
- .data
dataframe containing the variables to plot
- xvar
character string, name of the numerical variable to plot in quotes
- labels
character string, name of the character variable including the corresponding labels
- fill_colors
vector of character strings, hexadecimal colours to use for each labels in the piechart; the vector should contain the exact number of categories defined in
"labels"variable. (default to ECDC colors, seeEcdcColors(col_scale = "qual", n = nrow(.data)))
See also
Internal function: EcdcColors
Required Packages: ggplot
Examples
# --- Create dummy data
piechart <- data.frame(Labels = c("Heterosexual females",
                                  "Heterosexual males",
                                  "MSM",
                                  "Unknow"),
                       Values = c(1633,2937,15342,2854))

# --- Plot the dummy data
plotPie(piechart,
         xvar = "Values",
         labels = "Labels")