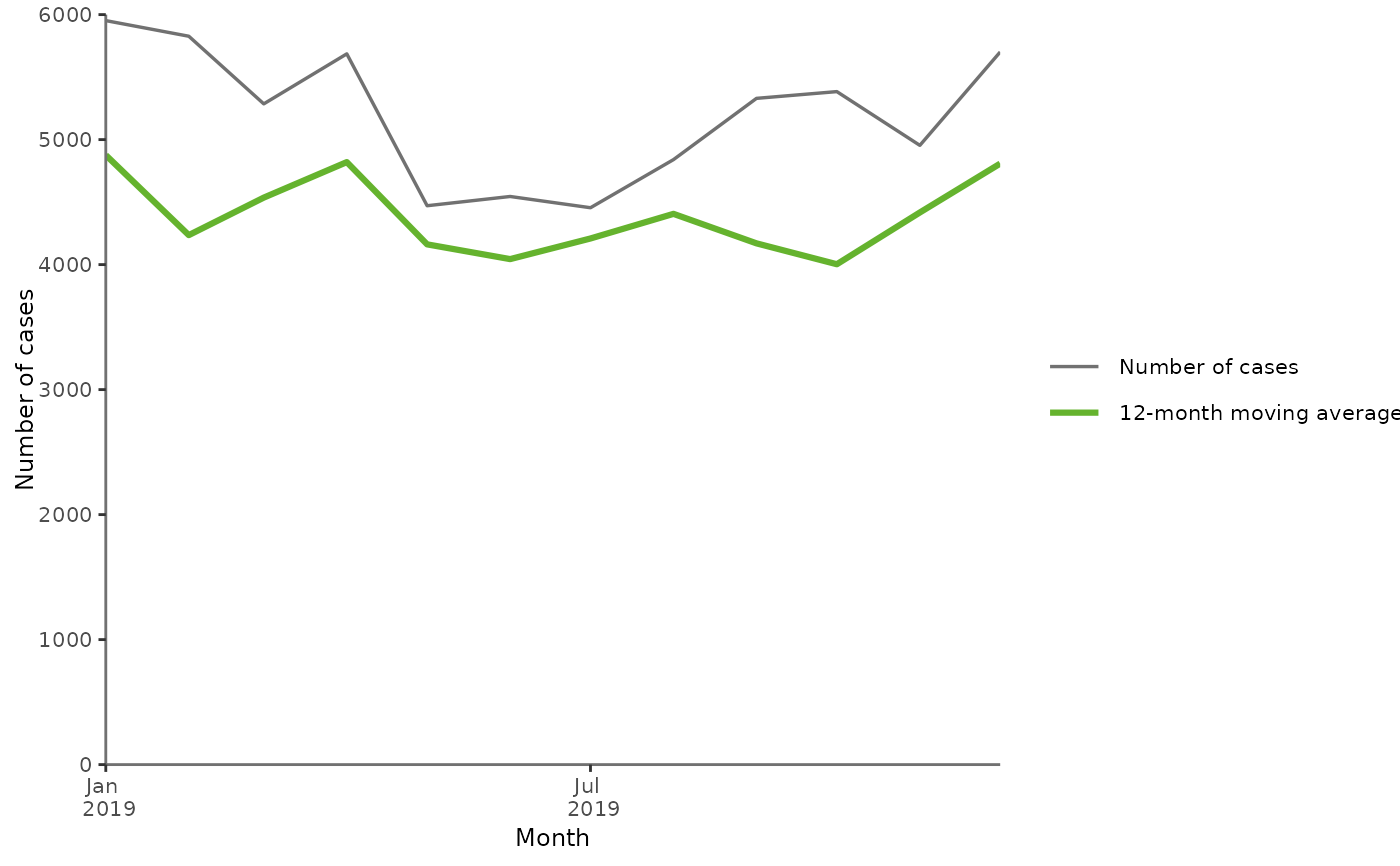
Time series with 12-month moving average
plotTS12MAvg.RdThis function draws a line graph describing the trend of the selected disease
over the past 5 years.
The graph includes the trend and number of cases at EU/EEA level, by month,
over the past five years, with:
yvar: The number of cases by month over the 5-year period (grey solid line)movAverage: The 12-month moving average of the number of cases by month (green solid line)
Expects aggregated data and pre-calculated 12-month moving average.
Arguments
- .data
dataframe containing the variables to plot
- xvar
character string, name of the time variable to plot on the x-axis in quotes (default
"TimeCode")- yvar
character string, name of the variable to plot on the y-axis in quotes (default
"N"), number of cases by month over the 5-year period (grey solid line)- movAverage
character string, name of the variable to plot in quotes including the moving average per each time unit (default
"MAV")