Get disease-specific trend plot: trend and number of cases by month
getTrend.RdFunction returning the plot describing the trend of the disease over time
that will be included in the epidemiological report at the bookmark location
'TS_TREND' on the template report.
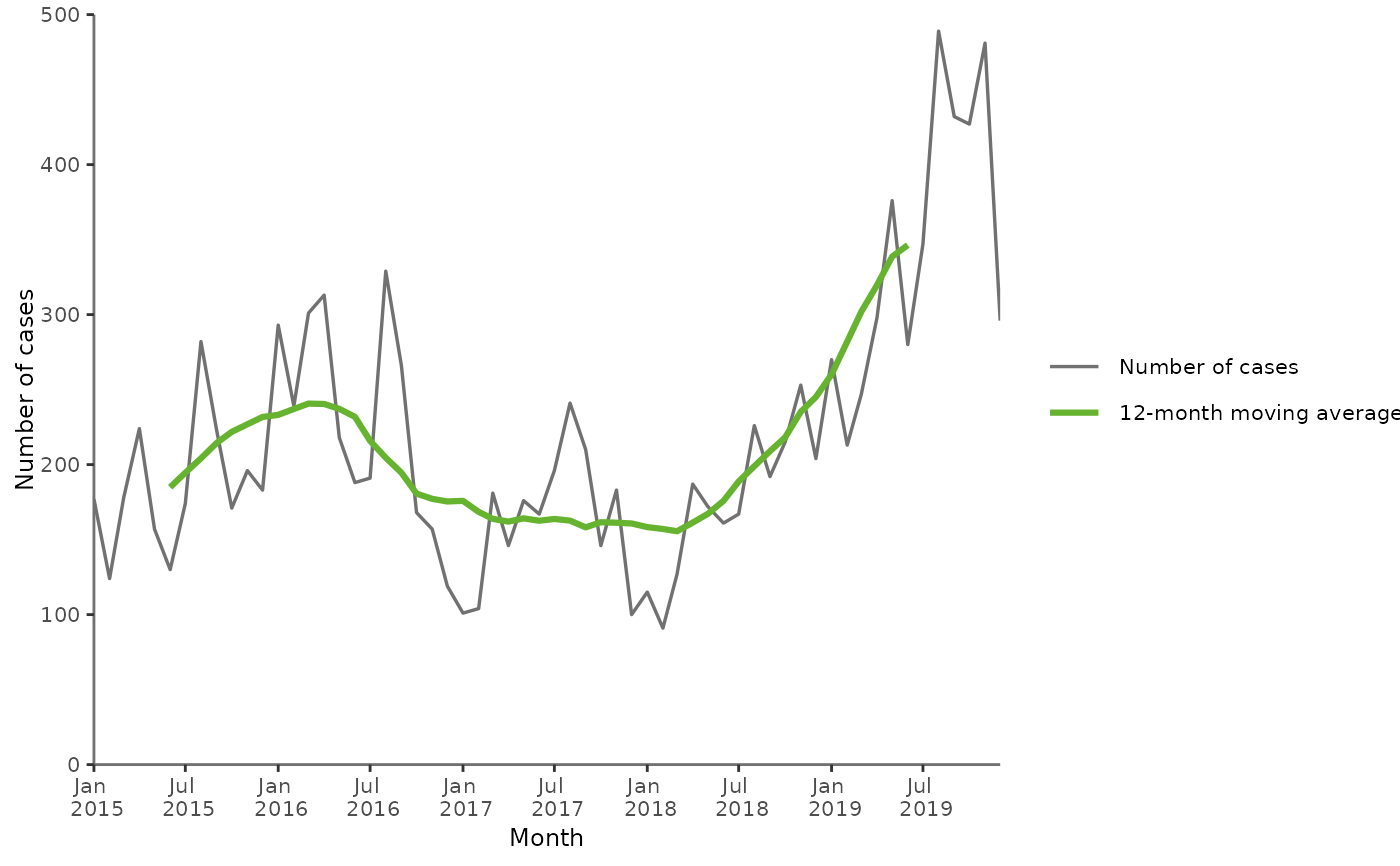
The graph includes the number of cases at EU/EEA level, by month,
over the past five years, with:
The number of cases by month over the 5-year period (grey solid line)
The 12-month moving average of the number of cases by month (green solid line)
(see ECDC reports https://www.ecdc.europa.eu/en/publications-data/monitoring/all-annual-epidemiological-reports)
Usage
getTrend(
  x = EpiReport::DENGUE2019,
  disease = "DENGUE",
  year = 2019,
  reportParameters = EpiReport::AERparams,
  MSCode = EpiReport::MSCode,
  index = 1,
  doc
)
Arguments
- x
dataframe, raw disease-specific dataset (see specification of the dataset in the package vignette with
browseVignettes(package = "EpiReport")) (defaultDENGUE2019)- disease
character string, disease code (default
"DENGUE"). Please make sure the disease code is included in the disease-specific dataset x in theHealthTopicCodevariable.- year
numeric, year to produce the graph for (default
2019). Please make sure the year is included in the disease-specific dataset x in theTimeCodevariable.- reportParameters
dataframe, dataset including the required parameters for the graph and report production (default
AERparams) (see specification of the dataset in the package vignette withbrowseVignettes(package = "EpiReport"))- MSCode
dataframe, correspondence table of GeoCode names and codes (default
MSCode) (see specification of the dataset in the package vignette withbrowseVignettes(package = "EpiReport"))- index
integer, figure number
- doc
'Word' document (see
officerpackage) in which to add the graph at the bookmark location. If doc is missing,getTrendreturns theggplot2object.
See also
Global function for the full epidemilogical report: getAER
Required Packages: ggplot body_replace_text_at_bkm
Internal functions: plotTS12MAvg
Default datasets: AERparams MSCode
Examples
# --- Plot using the default dataset
getTrend()


# --- Plot using external dataset
# --- Please see examples in the vignette
browseVignettes(package = "EpiReport")
#> No vignettes found by browseVignettes(package = "EpiReport")
# --- Plot using external dataset
# --- Please see examples in the vignette
browseVignettes(package = "EpiReport")
#> No vignettes found by browseVignettes(package = "EpiReport")